
13 Informative Graphs to Start Your Week
NO. 1: Board room gender equality
Source: @bpmehlman

NO. 2: The Federal Reserve far behind – 12% gap between real interest rates and core inflation rate
Source: Noahpinion

NO. 3: Reported in 2019, significant public opposition to overturning Roe v. Wade
Source: Pew Center Research

NO. 4: EV models are expected to double by 2024 – 130 to choose from
Source: visual capitalist

NO. 5: Why blockchain? Global and U.S. trust in the technology sector dropping
Source: visual capitalist
Consumers are less trusting of their financial data – block chain offers an alternative.

NO. 6: U.S. trade deficit increased to $109.8 billion in March - $20 billion above February’s deficit
Source: FRED

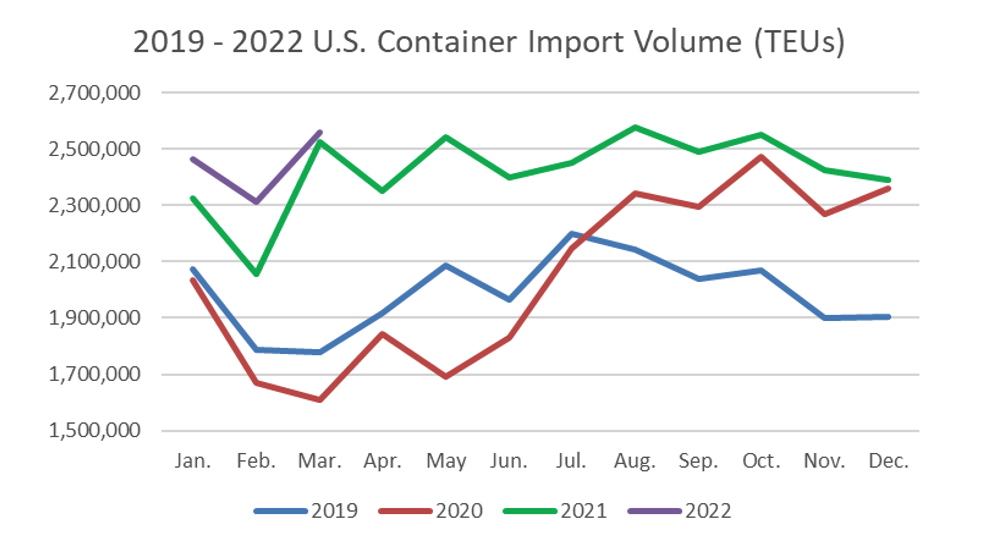
NO. 7: U.S. container import volume YOY comparison
Source: AJOT
NO. 8: Top 10 U.S. port average wait times (in days)

NO. 9: Natural gas prices, change since the end of April 2021
Source: WSJ

NO. 10: Supply chain stress test – Moody’s analytics index (benchmark to 100)
Source: Supply Chain Brain

NO. 11: Part of that stress, California ports

NO. 12: Older, longer tenured workers are resigning
Source: Vox

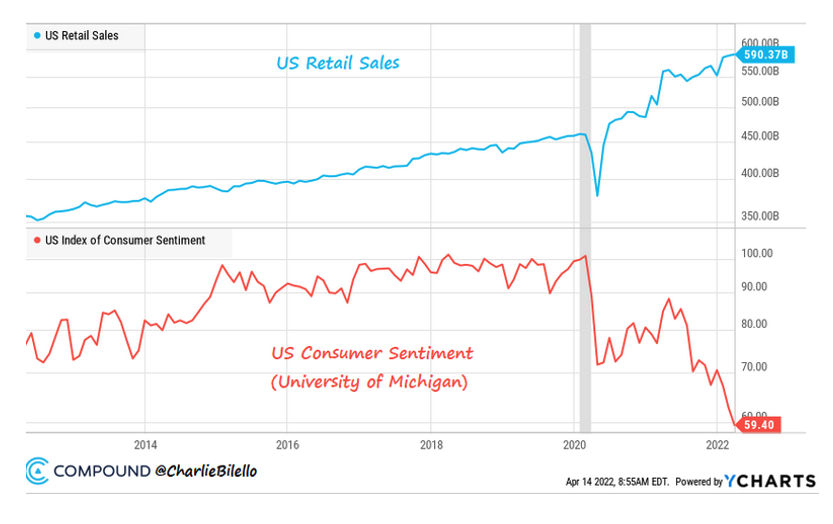
NO. 13: Consumers unhappy but still buying
Source: compound advisors
Huge gap between retail sales and consumer sentiment – how long can this last?
Featured


Follow Us On Instagram


Manifest 2024 served as a reminder of the immense potential that lies ahead in the realm of supply chain technology.