
Industry Indicators: May 9-15

Industry Indicators: May 9-15
iLevel Logistics presents intriguing data that offers a snapshot of notable industry changes and events during the week of May 9th through May 15th.
Diesel Prices Up
Source: U.S. Energy Information Administration
The announcement on May 12 of a ransomware attack on Colonial Pipeline refocused attention on fuel prices and sent many drivers flocking to the pumps. The national average price for gasoline and diesel topped $3 a gallon – and according to American Automobile Association that is the first time the national gas average surpassed $3 since 2014.
California diesel prices now top $4 a gallon, rising over 2 cents in a week and 8 cents from a year ago.

Expanding the time horizon places recent increases into perspective (see graph below). In July 2008, the national average price for a gallon of diesel was well over $4 a gallon - $4.718. And, as recently as 2014, the national average nearly reached $4.

Spot rates all up
As documented in Industry Indicators April 18-24, spot rates for Van, Flatbed, and Reefer were climbing. A month later, they remain on an upward trajectory. Flatbed and Reefer now top $3 per mile.

DAT also provides demand and capacity measures, which reflect the number of loads for every available truck. Across all three rates – van, flatbed, and reefer – 2021 load-to-truck ratios are impressive. The flatbed load-to-truck ratio surpassed 100 for the first time, reaching 102.7. This figure is 21% higher than the 2018 level and more than four times higher for the same week in 2020.


April class 8 orders down from March but still strong
Source: FTR
April 2021 class 8 truck orders of 34,600 units was the best April since 2018. Analysts expect continued strength as fleets anticipate needing additional trucks to expand capacity.

Cass Freight Indexes
Source: Cass Information Systems
The Cass index includes two components: First, shipments – a measure of the number of intro-continental freight shipments across the United States. This includes all modes, with truckload moves accounting for over 50% of shipments and LTL about 25%. Second, expenditures – total dollars spent on freight transportation – both contract and spot market rates.
In April, the shipments component grew year over year by nearly 30%.Clearly, a strong sign that the pandemic recovery is progressing quickly.
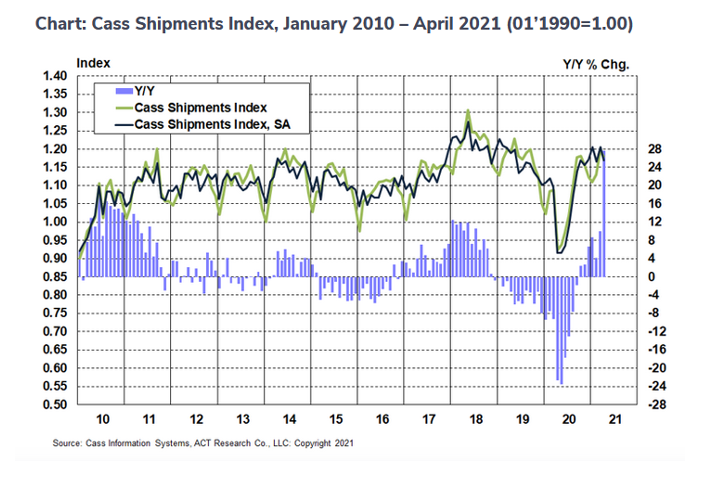
In April, the expenditure component set another record, growing 45% from a year ago and up 1.1% from March 2021.

Container rates climb and so do speeds
Source: VesselsValue
As container rates soar, vessels are moving faster. As a result of reduced demand last May, container speeds hit a five-year low. Now, average speeds are increasing and have jumped 5.5% since June 2020 – from 13.99 knots to 14.76 knots.

Average speeds by containerships are strongly correlated to charter rates. In other words, rates down, vessels slow down. But when rates escalate, containerships increase the pace.

Ocean carrier profits
Source: SupplyChainDigest
The chart below tracks quarterly profits and profit margins for ocean container carriers. After modest profits and even losses during the past few years, carrier’s bottom line took off starting Q2 2020. How long does this continue?

Intermodal volume up for third consecutive quarter
Source: HDT Truckinginfo
The growth in intermodal volumes is expected to continue through the remainder of the year.

The big crack
Source: The Trucker, Land Line, SupplyChainBrain
On May 11, a major crack was discovered on the I-40 bridge spanning the Mississippi River between Arkansas and Tennessee. The crack prompted an emergency closure and shut down the bridge indefinitely. The bridge is 48 years old and carries over 40,000 vehicles a day – nearly a third of those vehicles are trucks.


Now, over 700 barges are stuck on the Mississippi river! The Mississippi route is key for U.S. agricultural exports – specifically Midwest corn and beans.

Thanks for reading!
To sign up for our free Daily readings click here