
Industry Indicators: January 3rd - 14th
iLevel Logistics presents intriguing data that offers a snapshot of notable industry changes and events during the weeks of January 3rd through the 14th.

Industry Indicators: January 3rd - 14th
iLevel Logistics presents intriguing data that offers a snapshot of notable industry changes and events during the weeks of January 3rd through the 14th.
What’s on the docket this week?
Demand for electric vehicles, electric vehicle chargers, logistics manager index, job market, job quits by industry, business inventory, new measure of supply chain pressure, spot rates, owner-ops optimistic about 2022, keys to great shipping facility, LMI index, broad economic indicators, class 8 orders, import/export imbalance, YOY retail imports, public opinion, diesel fuel prices, shipping costs from China, CPI YOY, container turnaround times, California ports ship queues, expect higher inflation.
Very little consumer demand for electric vehicles
Source: Axios
Nearly 70% of respondents want a gasoline or diesel vehicle for next purchase – 5% prefer battery electric

Ratio of electric vehicles to public chargers
Source: Statista

Logistics Manager Index – transportation, warehouse and inventory costs continue to rise
Source: SupplyChainBrain

Workers have leverage – unemployment lower, quit rates higher
Source: Fortune

Job quits concentrated in leisure and hospitability, retail, and lower wage sectors directly impacted by pandemic.

Businesses stockpile products ahead of holidays – raising concerns about the “bullwhip effect”
Source: MSN
Unusual that inventories rose in December. Typically, companies clear out merchandise during the holiday rush. Accordingly, some supply chains may be carrying too much inventory – as firms chose to stock up rather than run out.

New measure of global supply chain pressures
Source: Federal Reserve Bank of New York
The Global Supply Chain Pressure Index (GSCPI) integrates a number of conventional metrics to offer a more comprehensive summary of disruptions influencing supply chains. Positive values indicate greater pressures on the supply chain – whereas negative values suggest the opposite. Notice the GSCPI jumps notably at the beginning of the pandemic when China imposed lockdowns. It then fell briefly as things re-opened in summer of 2020, before rising again last winter – and staying elevated thereafter.

Spot rates record high in 2021
Source: OverDrive

Many owner-ops are optimistic about 2022
Source: OverDrive

What factors drivers say make for great shipping facilities – service, dwell time, wait times, amenities, and parking.

The logistic industry still in growth mode
Source: DCVelocity
The LMI index remained above 70 for the past 11 months, reflecting strong expansion across the industry – readings of 50 indicate growth and readings below 50 contraction.

Broad economic indicators
Source: Compound


Class 8 orders jump back up in December
Source: TruckingInfo

Import – Export imbalance – imports surge, the story of 2021
Source: WSJ Logistic Report

YOY monthly retail imports – TEUs millions
Source: NRF

The priority is the economy, say most Americans
Source: AP
Note the changes from 2021 to 2022 for various issues – but not for the economy.

Diesel Fuel up 4 cents
Source: EIA

Shipping costs from China leveling but at historically high levels
Source: AJOT

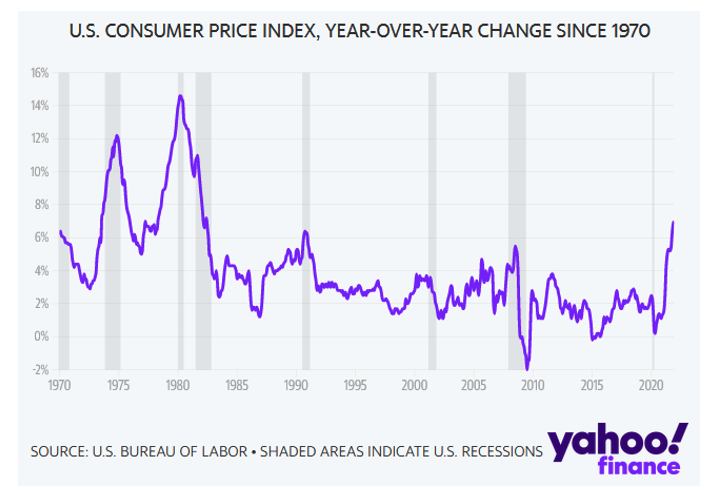
CPI highest in nearly 40 years – 7% YOY
Source: Yahoo Finance

Container turnaround 5 days in China, 50 days in United States
Source: DCVelocity

A visit between Secretary Pete Buttigieg and Port of LA Executive Director Gene Seroka - celebrating their efforts to reduce bottlenecks and backlogs at the port.

The happened on the day ports set yet another record for daily number of container ships in queue awaiting berth.

graph: SCDigest
Inflation will be higher than current CPI suggests
Source: Asian Times
Housing costs represent about a third of household expenditures. And, according to private sites, Zillow and Apartments.com, the cost of buying and renting is up nearly 20%. However, the government CPI reported housing increased just 4.2 over the past year.
Why the difference? Time lag. The government examines the present cost of housing while private sites record the cost of new housing/rentals. It takes time for old leases to expire and new mortgages to be registered. In other words, it simply takes awhile for the government CPI to reflect new housing costs. Once it catches up, the government’s next CPI will undoubtedly increase – more than most estimate. Housing makes up 32.3% of the CPI! The graph demonstrates the point. Examine the notable divergence in CPI and private estimates. Thus, over the next few months, expect the green line to rise considerably.

That’s all for this week. Thanks for reading.


Follow Us On Instagram


Manifest 2024 served as a reminder of the immense potential that lies ahead in the realm of supply chain technology.