
Fueling Savings, Pay Dismay, and Supply Chain Surprises: A Visual Insight into Today's Economic Landscape
Fueling Savings!
U.S. gasoline prices have fallen for 60 straight days, marking the longest streak of decline in over a year. The average price is now $3.25, which is more than 60 cents below the peak in mid-September.

Evolting Choices!
Cost of electricity by various fuel types, including renewable and nonrenewable sources

Pay Dismay!
It appears that wage growth is over. Year-over-year percentage change in average hourly earnings in the U.S.

Relatedly, job openings have been falling sharply.

Inflated Pressures
Supply chain pressures are strongly linked to U.S. inflation, pushing up input costs for goods production. The post-pandemic correlation between these two measures is moderately strong at 0.53, whereas during the pre-pandemic period (1997-2019), the correlation was much lower at 0.24.

Oil Overtake!
Perhaps surprising to many, we now produce nearly 50% more oil than Saudi Arabia.

Tesla's Price Slide!
The average price of a used Tesla has declined for 16 consecutive months, dropping from a record high of $67,900 in July 2022 to a new record low of $39,002, marking a 43% decline.

Related, used car prices are at their lowest levels in 28 months.

Economic Supremacy!
In 2023, the U.S. is projected to have the largest economy at $26.9 trillion, which is greater than the combined GDP of 175 countries. China is second with a projected GDP of $19.4 trillion.

Walmart: World's Retail Giant
Walmart isn't just the largest retailer in the U.S.; it's also the biggest retailer in the world, with global sales surpassing $600 billion.

Phoenix Rails South
Union Pacific will open a new intermodal terminal in Phoenix to provide rail service to the ports of San Pedro Bay, offering a direct route to Southern California.

Class 8 Vehicle Orders Soar!
Net orders for Class 8 vehicles last month increased by 9,000 from October and by 9,000 year-over-year figures.

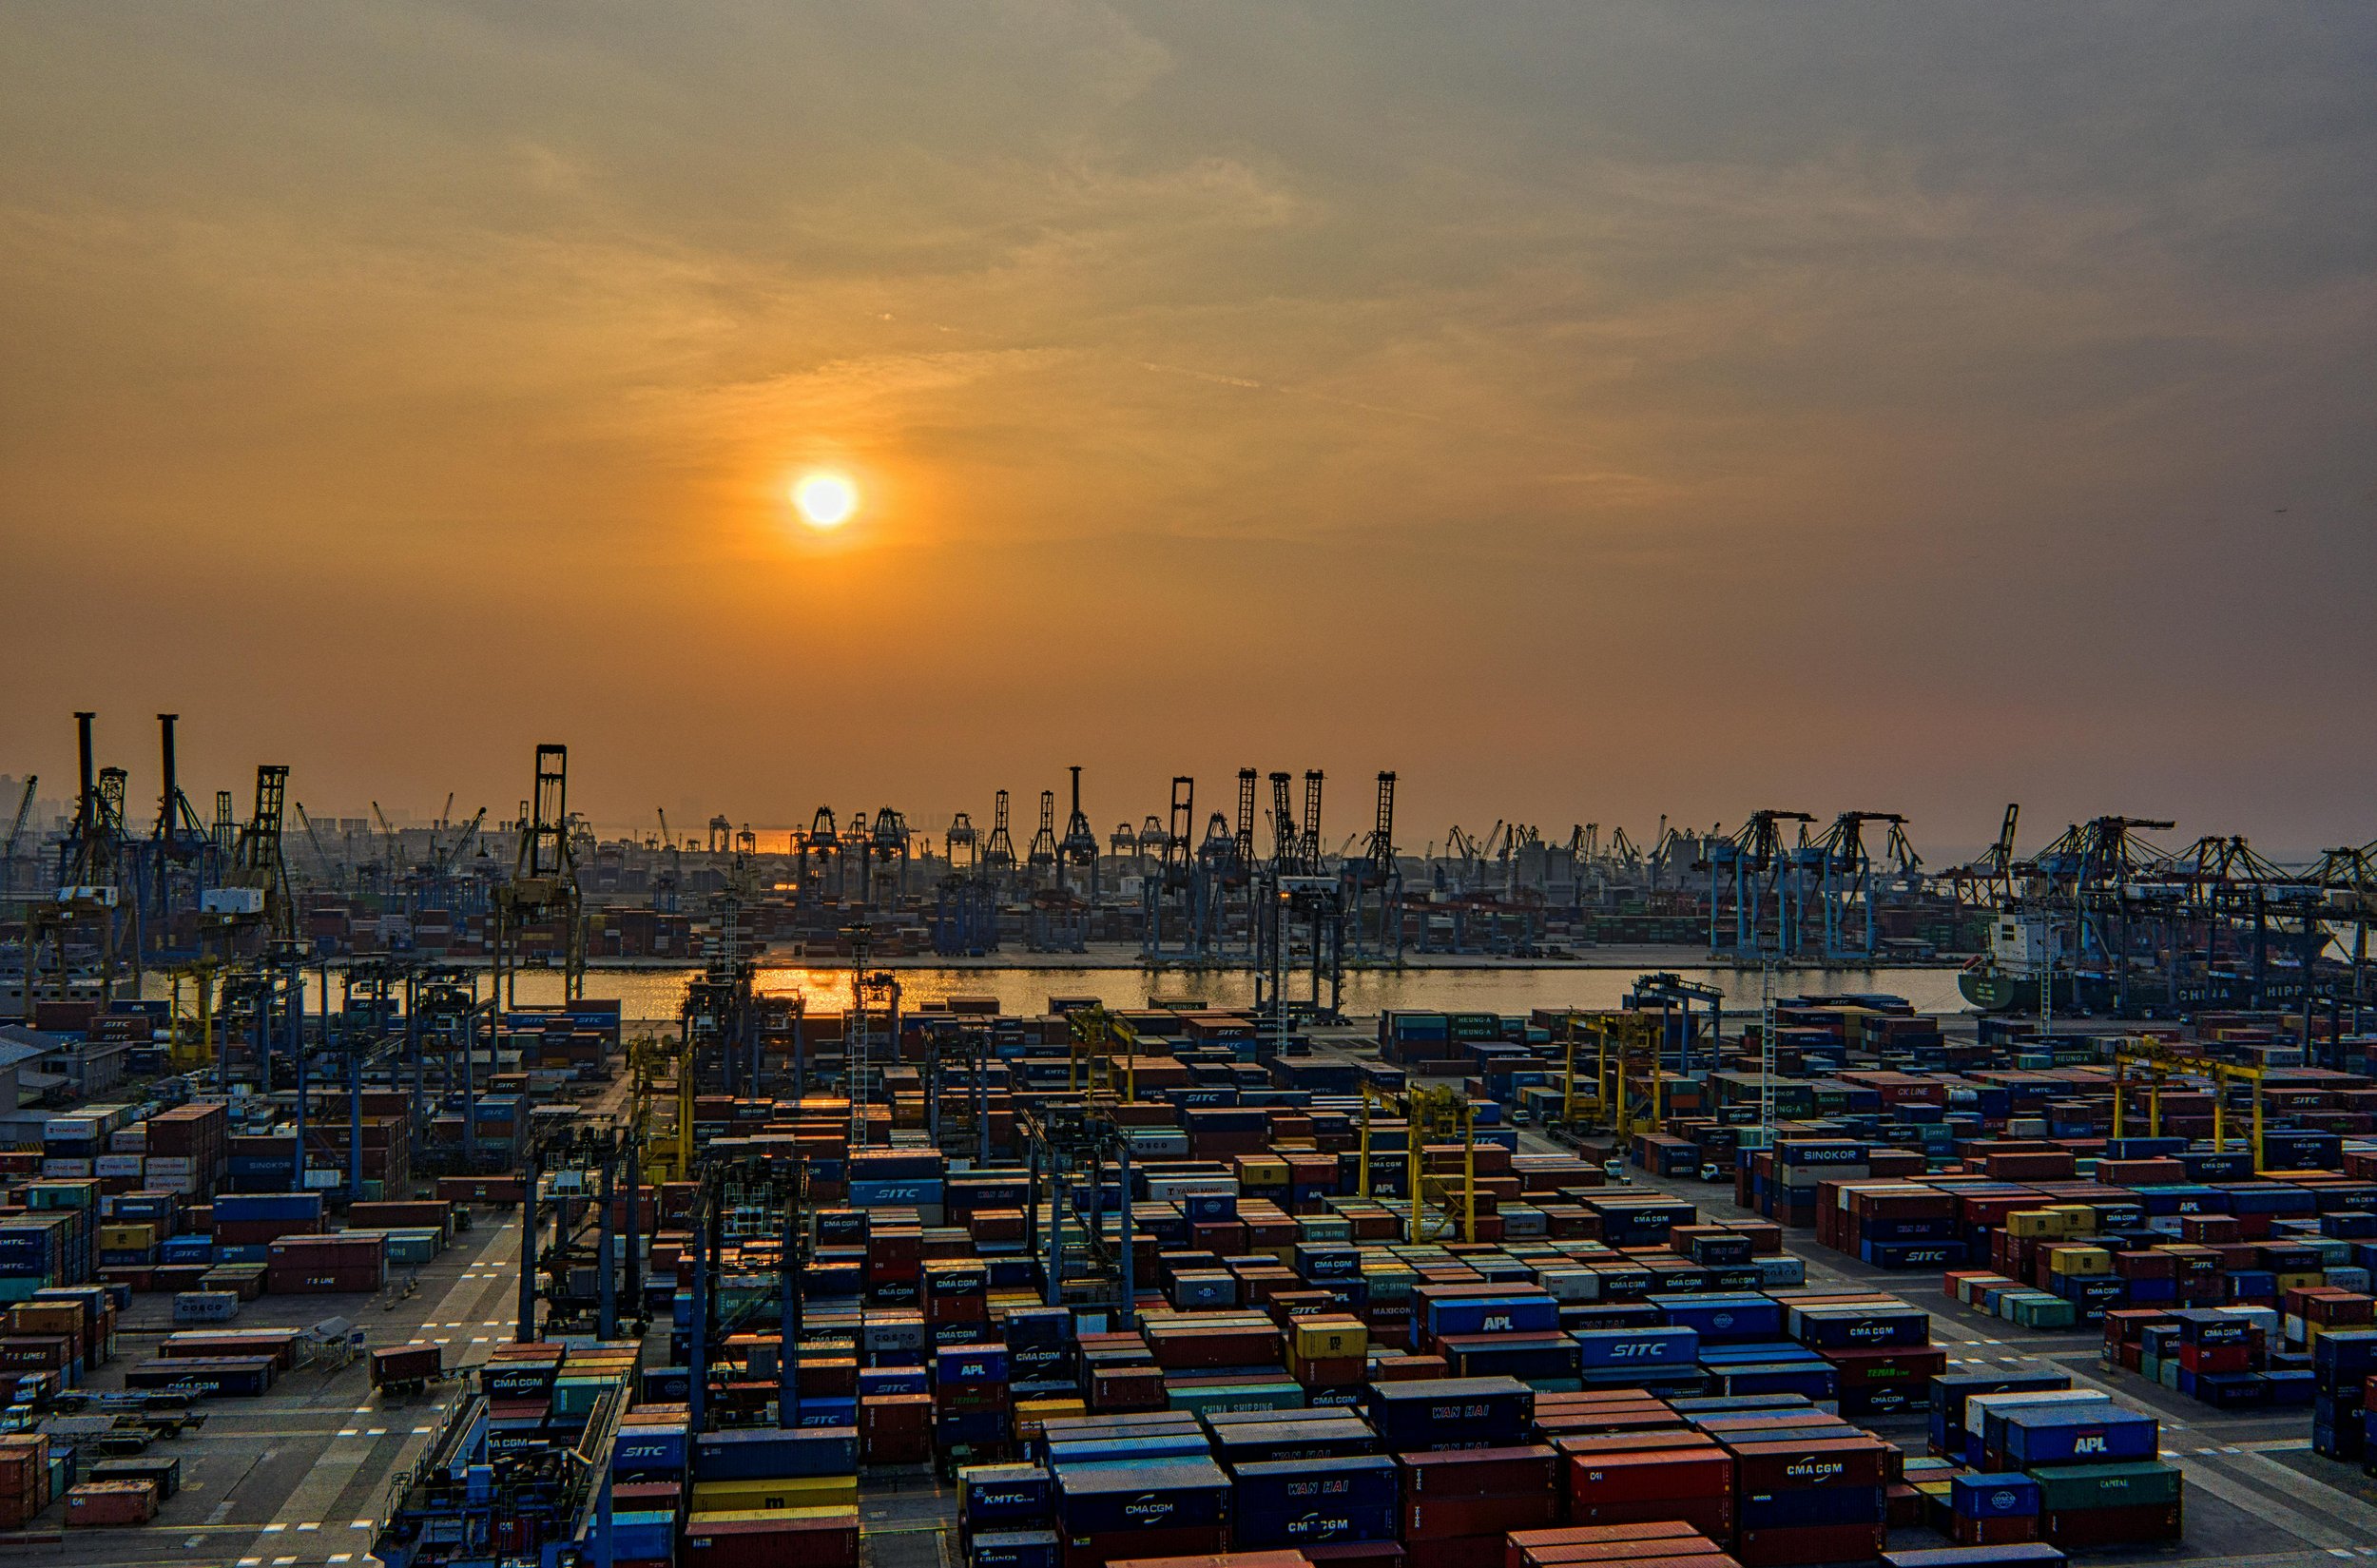
Supply Chain Swings
The Global Supply Chain Volatility Index is based on data derived from S&P Global's PMI surveys. A value above 0 indicates that the supply chain capacity is stretched, and volatility is increasing. A value below 0 indicates that supply chain capacity is being underutilized, reducing supply chain volatility. Notice in the chart that the value is below zero, returning to levels exhibited in the early months of 2020. Also, note the peak in 2022, with values above 5, indicating extremely high levels of supply chain volatility.

A similar pattern is shown in container shipping rates.

Logistics Index Slips
The Monthly Logistics Managers Index fell by 7 points in October. LMI researchers attributed the slowdown to a decline in inventory levels due to 4th-quarter holiday sales, as well as slowdowns in transportation and warehousing utilization.

28 Months of Low Sentiment
We're not in a recession, but the University of Michigan Consumer Sentiment has now been below 75 for 28 consecutive months, tying Feb 08 – May 10 for the longest run of negative sentiment on record.


Manifest 2024 served as a reminder of the immense potential that lies ahead in the realm of supply chain technology.