
The State of the Supply Chain: Early January 2023
Guilty of being in "demurrage"
Demurrage refers to the charge that a cargo owner pays for the use of a container within the terminal. Detention refers to the charge for the use of a container outside of the terminal. During the height of the pandemic, many complained about demurrage fees, especially at Los Angeles and Long Beach ports. The chart below demonstrates the average demurrage and detention charges in U.S. dollars – during 2020 across worldwide ports.
Clearly, Los Angeles and Long Beach lead the way. Compare those two ports, for example, to Hamburg or Rotterdam.

LNG is so cold because it’s always "on the rocks"
Recently, the US tied Qatar as the world's top exporter of liquefied natural gas. In 2022, both countries exported 81.2 million tons. The United States’ extraordinary rise can in part be attributed to the shift away from Russian pipeline gas in Europe – which increased demand for US LNG.

Looking for private stock in the distribution game?
Private investment in supply-chain technology companies is on a roll since early 2021. And experts anticipate this will continue. Private equity investors have been bankrolling logistic tech companies at about $9 billion a quarter since Q4 2020. The startups valued at $1 billion have more than doubled to 60 in just 18 months.

Lessening the carbon footprint
The chart below shows the total 2019 U.S. Green House Gas Emissions by source. Transportation comprises 33% of total GHG emissions and light-duty vehicles represent nearly half (49%) of transportation emissions. Medium and heavy vehicles represent 21%.

Carriers are driving right out of the industry
Among other things, declining spot rates are driving carriers out of trucking. The net population of carriers is now in sharp decline. Starting in October 2022, the number has dropped notably. In December, the industry lost more carriers than in any month on record – except December 2005.

The leopard is changing its spots
Speaking of spot rates, the 2021 surge, and then the 2022 slump, appears to be returning to normal. The chart below shows spot rates inching closer to the 5-year average – after being considerably above that for many months.

Signed, sealed, delivered
It’s been a while, but the contract rate now exceeds spot rates by a significant margin. In fact, the spread is the largest in over a decade. However, that gap appears to be tightening over the past several months.

A lack of Pacific-ation
U.S. manufacturing – spurred on by the Biden administration – is on the rise. However, notice the absence of new investments on the west coast. Look at the dominance of the East!

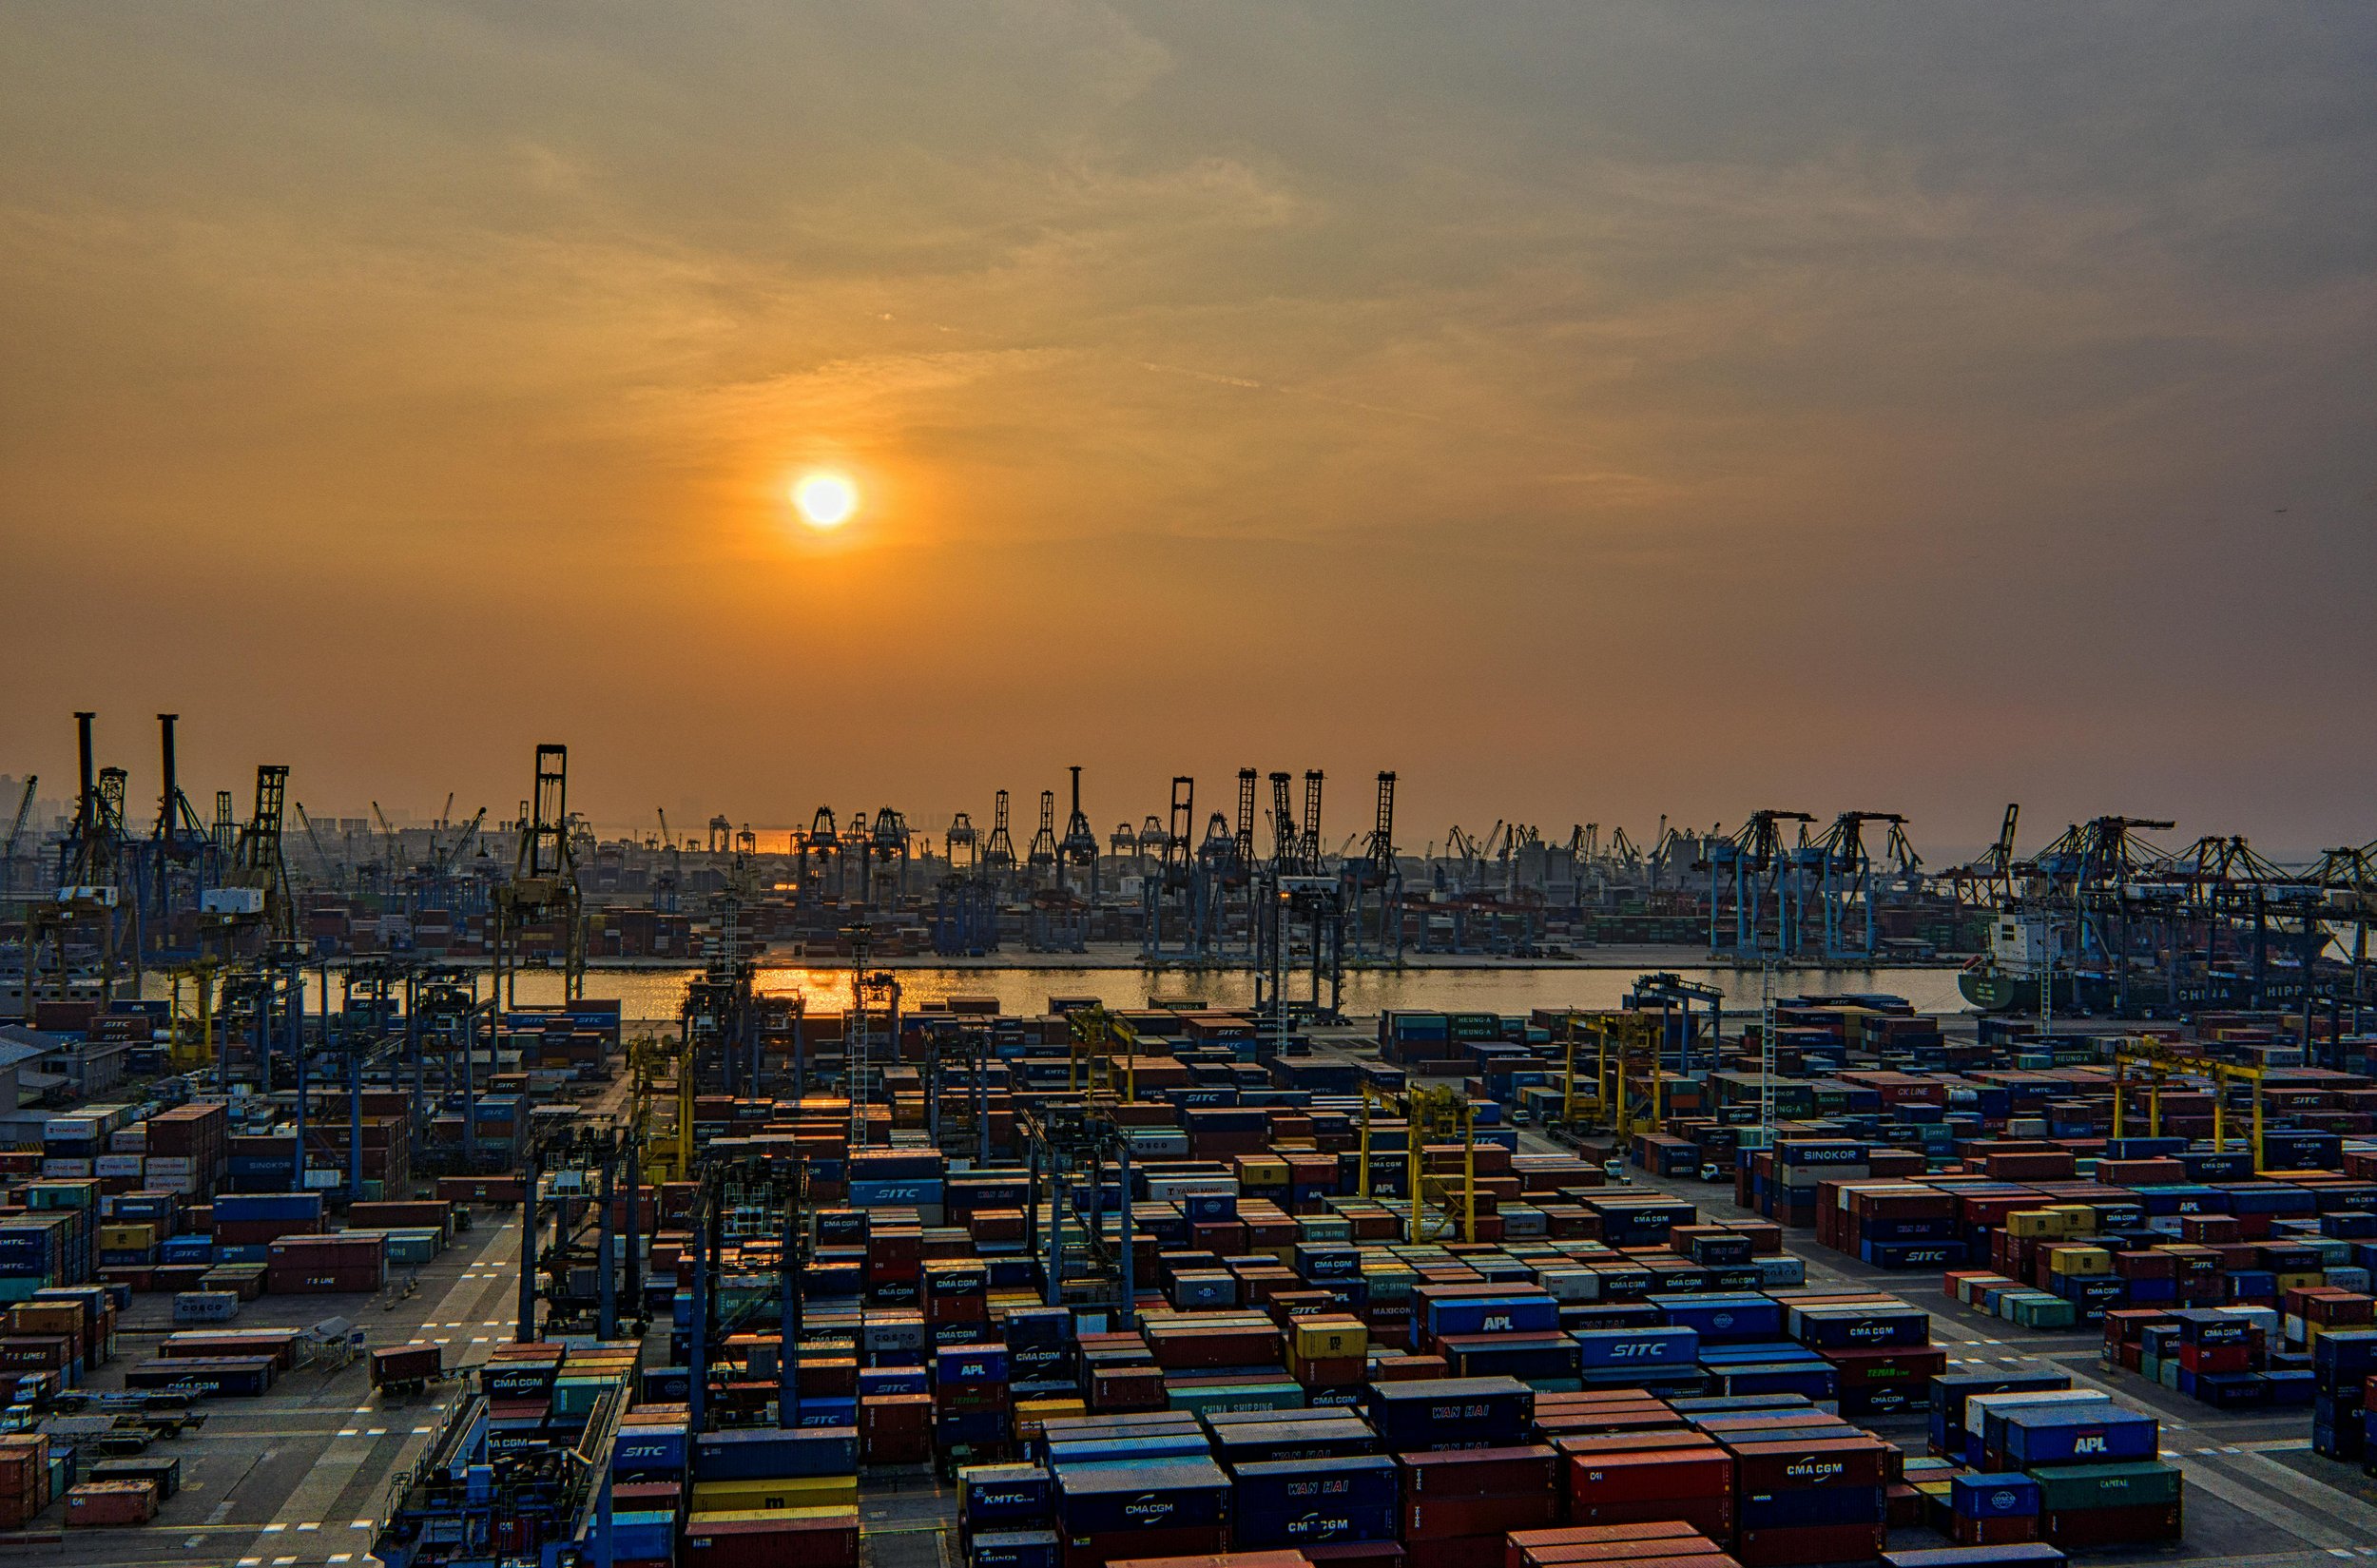
Container-tunity in Asia
Asia continues to be the place for worldwide port container throughput.

The Baltic Dry Index cannot keep up with tide-ing demand
The Baltic Dry Index below, a measure of pricing for bulk raw materials transport and a leading indicator of industrial production, has fallen by nearly half since Christmas.

Guilty of a freight-ful offenses
Cargo theft increased by 15% in 2022 – with 223 million in total losses. California, Texas, and Florida represent nearly half of all thefts.

As 2023 unfolds, iLevel Road Scholar will continue to scout out charts and statistics that depict developments in transportation and supply chains.


Manifest 2024 served as a reminder of the immense potential that lies ahead in the realm of supply chain technology.